反调试技术
静态反调试技术
通过一些API探测调试器,并使程序无法运行
PEB
PEB结构体信息可以判断进程是否处于调试状态
IsDebuggerPresent()
Windows API 提供的一个简单方法,用于判断当前进程是否在调试状态下运行。
示例代码
1
2
3
4
5
6
7
8
9
10
11
12
13
14
15
16
17
18
19
20
21
22
23
24
25
26
27
28
29
30
31
| #include <iostream>
#include <windows.h>
#include <string>
int main()
{
bool antiDebugSuccess = false;
std::string methodUsed = "";
if (IsDebuggerPresent())
{
methodUsed = "IsDebuggerPresent()";
antiDebugSuccess = true;
}
if (antiDebugSuccess)
{
std::string msg = "反调试功能: " + methodUsed + "\n反调试是否成功: Yes";
MessageBoxA(NULL, msg.c_str(), "检测到调试器", MB_OK | MB_ICONWARNING);
}
else
{
std::cout << "helloworld" << std::endl;
}
return 0;
}
|
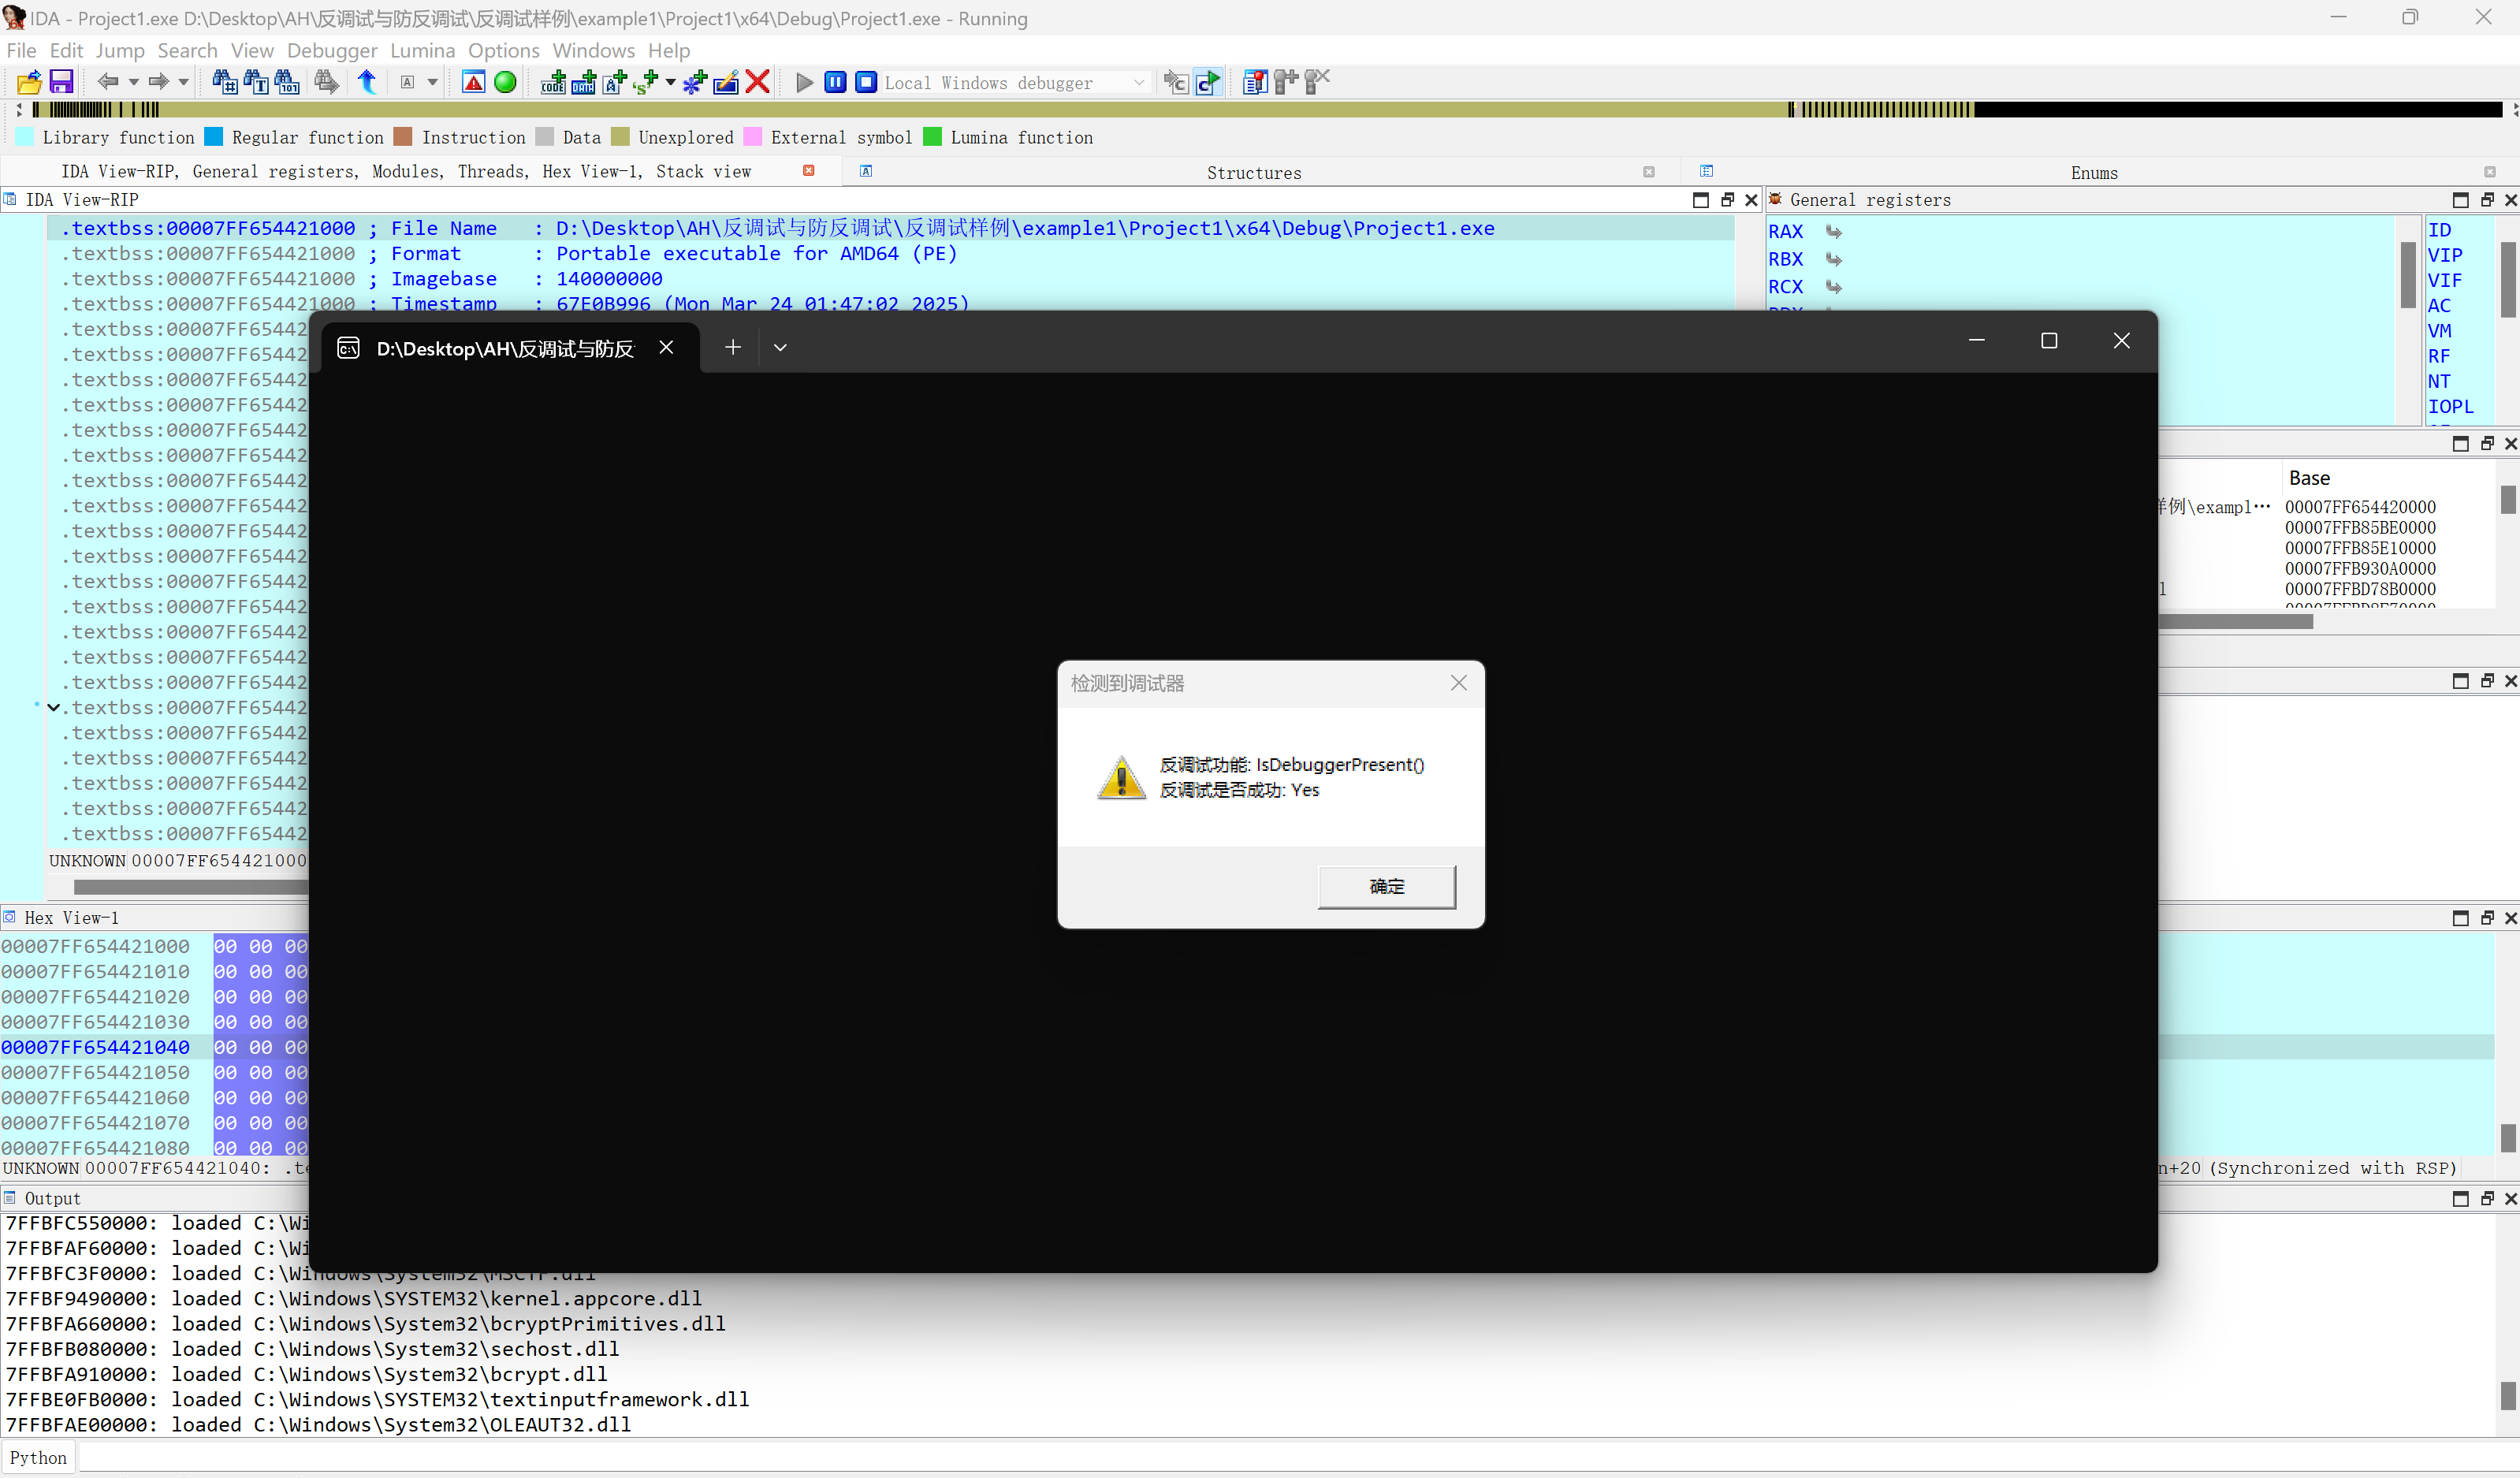
实现效果 (以IDA为例)
IsDebuggerPresent原理
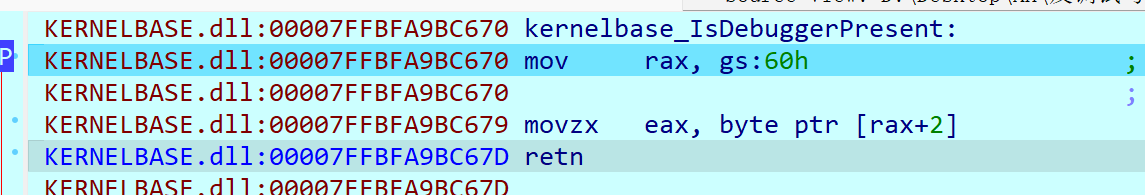
x64下 gs : 60h 指向PEB ,
访问PEB的BeingDebugged 标志来判断是否处于调试状态。
x64PEB的结构内容
1
2
3
4
5
6
7
8
9
10
11
12
13
14
15
16
17
18
19
20
21
22
23
24
25
26
27
28
29
30
31
32
33
34
35
36
37
38
39
40
41
42
43
44
45
46
47
48
49
50
51
52
53
54
55
56
57
58
59
60
61
62
63
64
65
66
67
68
69
70
71
72
73
74
75
76
77
78
79
80
81
82
83
84
85
86
87
88
89
90
91
| +0x000 InheritedAddressSpace : UChar
+0x001 ReadImageFileExecOptions : UChar
+0x002 BeingDebugged : UChar
+0x003 BitField : UChar
+0x003 ImageUsesLargePages : Pos 0, 1 Bit
+0x003 IsProtectedProcess : Pos 1, 1 Bit
+0x003 IsLegacyProcess : Pos 2, 1 Bit
+0x003 IsImageDynamicallyRelocated : Pos 3, 1 Bit
+0x003 SkipPatchingUser32Forwarders : Pos 4, 1 Bit
+0x003 SpareBits : Pos 5, 3 Bits
+0x008 Mutant : Ptr64 Void
+0x010 ImageBaseAddress : Ptr64 Void
+0x018 Ldr : Ptr64 _PEB_LDR_DATA
+0x020 ProcessParameters : Ptr64 _RTL_USER_PROCESS_PARAMETERS
+0x028 SubSystemData : Ptr64 Void
+0x030 ProcessHeap : Ptr64 Void
+0x038 FastPebLock : Ptr64 _RTL_CRITICAL_SECTION
+0x040 AtlThunkSListPtr : Ptr64 Void
+0x048 IFEOKey : Ptr64 Void
+0x050 CrossProcessFlags : Uint4B
+0x050 ProcessInJob : Pos 0, 1 Bit
+0x050 ProcessInitializing : Pos 1, 1 Bit
+0x050 ProcessUsingVEH : Pos 2, 1 Bit
+0x050 ProcessUsingVCH : Pos 3, 1 Bit
+0x050 ProcessUsingFTH : Pos 4, 1 Bit
+0x050 ReservedBits0 : Pos 5, 27 Bits
+0x058 KernelCallbackTable : Ptr64 Void
+0x058 UserSharedInfoPtr : Ptr64 Void
+0x060 SystemReserved : [1] Uint4B
+0x064 AtlThunkSListPtr32 : Uint4B
+0x068 ApiSetMap : Ptr64 Void
+0x070 TlsExpansionCounter : Uint4B
+0x078 TlsBitmap : Ptr64 Void
+0x080 TlsBitmapBits : [2] Uint4B
+0x088 ReadOnlySharedMemoryBase : Ptr64 Void
+0x090 HotpatchInformation : Ptr64 Void
+0x098 ReadOnlyStaticServerData : Ptr64 Ptr64 Void
+0x0a0 AnsiCodePageData : Ptr64 Void
+0x0a8 OemCodePageData : Ptr64 Void
+0x0b0 UnicodeCaseTableData : Ptr64 Void
+0x0b8 NumberOfProcessors : Uint4B
+0x0bc NtGlobalFlag : Uint4B
+0x0c0 CriticalSectionTimeout : _LARGE_INTEGER
+0x0c8 HeapSegmentReserve : Uint8B
+0x0d0 HeapSegmentCommit : Uint8B
+0x0d8 HeapDeCommitTotalFreeThreshold : Uint8B
+0x0e0 HeapDeCommitFreeBlockThreshold : Uint8B
+0x0e8 NumberOfHeaps : Uint4B
+0x0ec MaximumNumberOfHeaps : Uint4B
+0x0f0 ProcessHeaps : Ptr64 Ptr64 Void
+0x0f8 GdiSharedHandleTable : Ptr64 Void
+0x100 ProcessStarterHelper : Ptr64 Void
+0x108 GdiDCAttributeList : Uint4B
+0x110 LoaderLock : Ptr64 _RTL_CRITICAL_SECTION
+0x118 OSMajorVersion : Uint4B
+0x11c OSMinorVersion : Uint4B
+0x120 OSBuildNumber : Uint2B
+0x122 OSCSDVersion : Uint2B
+0x124 OSPlatformId : Uint4B
+0x128 ImageSubsystem : Uint4B
+0x12c ImageSubsystemMajorVersion : Uint4B
+0x130 ImageSubsystemMinorVersion : Uint4B
+0x138 ActiveProcessAffinityMask : Uint8B
+0x140 GdiHandleBuffer : [60] Uint4B
+0x230 PostProcessInitRoutine : Ptr64 void
+0x238 TlsExpansionBitmap : Ptr64 Void
+0x240 TlsExpansionBitmapBits : [32] Uint4B
+0x2c0 SessionId : Uint4B
+0x2c8 AppCompatFlags : _ULARGE_INTEGER
+0x2d0 AppCompatFlagsUser : _ULARGE_INTEGER
+0x2d8 pShimData : Ptr64 Void
+0x2e0 AppCompatInfo : Ptr64 Void
+0x2e8 CSDVersion : _UNICODE_STRING
+0x2f8 ActivationContextData : Ptr64 _ACTIVATION_CONTEXT_DATA
+0x300 ProcessAssemblyStorageMap : Ptr64 _ASSEMBLY_STORAGE_MAP
+0x308 SystemDefaultActivationContextData : Ptr64 _ACTIVATION_CONTEXT_DATA
+0x310 SystemAssemblyStorageMap : Ptr64 _ASSEMBLY_STORAGE_MAP
+0x318 MinimumStackCommit : Uint8B
+0x320 FlsCallback : Ptr64 _FLS_CALLBACK_INFO
+0x328 FlsListHead : _LIST_ENTRY
+0x338 FlsBitmap : Ptr64 Void
+0x340 FlsBitmapBits : [4] Uint4B
+0x350 FlsHighIndex : Uint4B
+0x358 WerRegistrationData : Ptr64 Void
+0x360 WerShipAssertPtr : Ptr64 Void
+0x368 pContextData : Ptr64 Void
+0x370 pImageHeaderHash : Ptr64 Void
+0x378 TracingFlags : Uint4B
+0x378 HeapTracingEnabled : Pos 0, 1 Bit
+0x378 CritSecTracingEnabled : Pos 1, 1 Bit
+0x378 SpareTracingBits : Pos 2, 30 Bits
|
1
2
3
4
5
6
7
8
| //查询信息的接口,输入参数包括查询的信息类型、进程HANDLE、结果指针等。
NTSYSAPI NTSTATUS NTAPI NtQueryInformationProcess (
IN HANDLE ProcessHandle, // 进程句柄
IN PROCESSINFOCLASS InformationClass, // 信息类型
OUT PVOID ProcessInformation, // 缓冲指针
IN ULONG ProcessInformationLength, // 以字节为单位的缓冲大小
OUT PULONG ReturnLength OPTIONAL // 写入缓冲的字节数
);
|
CheckRemoteDebuggerPresent
kernel32的CheckRemoteDebuggerPresent()函数用于检测指定进程是否正在被调试
1
2
3
4
| BOOL WINAPI CheckRemoteDebuggerPresent(
_In_ HANDLE hProcess,
_Inout_ PBOOL pbDebuggerPresent
);
|
如果调试器存在 (通常是检测自己是否正在被调试), 该函数会将pbDebuggerPresent指向的值设为0xffffffff.
反反调试脚本
1. Hook IsDebuggerPresent 等 (IDA插件)
1
2
3
4
5
6
7
8
9
10
11
12
13
14
15
16
17
18
19
20
21
22
23
24
25
26
27
28
29
30
31
32
33
34
35
36
37
38
39
40
41
42
43
44
45
46
47
48
49
50
51
52
53
54
55
56
57
58
59
60
61
62
63
64
65
66
67
68
69
70
71
72
73
74
75
76
77
78
79
80
81
82
83
84
85
86
87
88
89
90
91
92
93
94
95
96
97
98
99
100
101
102
103
104
105
106
107
108
109
110
111
112
113
114
115
116
| import idaapi
import idautils
import idc
class UltimateAntiDebugPlugin(idaapi.plugin_t):
flags = idaapi.PLUGIN_UNL
comment = "Ultimate Anti-Debug Bypass"
help = "Patches debug checks via multiple approaches"
wanted_name = "UltimateAntiDebug"
wanted_hotkey = "Ctrl+Alt+U"
def init(self):
return idaapi.PLUGIN_OK
def get_import_address(self, func_name):
imp_name = f"__imp_{func_name}"
ea = idaapi.get_name_ea(idaapi.BADADDR, imp_name)
if ea != idaapi.BADADDR:
return idaapi.get_qword(ea) if idaapi.get_inf_structure().is_64bit() else idaapi.get_dword(ea)
ea = idaapi.get_name_ea(idaapi.BADADDR, func_name)
if ea != idaapi.BADADDR:
return ea
for ref in idautils.CodeRefsTo(idaapi.get_name_ea(idaapi.BADADDR, func_name), 0):
if idc.print_insn_mnem(ref) == "call":
target = idc.get_operand_value(ref, 0)
if target != idaapi.BADADDR:
return target
return idaapi.BADADDR
def patch_function(self, ea, patch_hex):
"""patch函数"""
if ea == idaapi.BADADDR:
return False
current_bytes = idaapi.get_bytes(ea, len(patch_hex)//2)
if current_bytes == bytes.fromhex(patch_hex):
return True
original = idaapi.get_bytes(ea, len(patch_hex)//2)
if not original:
return False
if not idaapi.patch_bytes(ea, bytes.fromhex(patch_hex)):
return False
idc.set_cmt(ea, f"[AntiDebug] ORIG: {original.hex()}", 0)
return True
def run(self, arg):
print("\n===== Ultimate Anti-Debug =====")
targets = [
("IsDebuggerPresent", "31C0C3"),
("CheckRemoteDebuggerPresent", "31C0C3"),
("OutputDebugStringA", "C3"),
("NtQueryInformationProcess", "B800000000C3")
]
for func_name, patch_code in targets:
func_ea = self.get_import_address(func_name)
if func_ea == idaapi.BADADDR:
print(f"[!] {func_name} address not found")
continue
if self.patch_function(func_ea, patch_code):
print(f"[+] Patched {func_name} at {hex(func_ea)}")
call_count = 0
for ref in idautils.CodeRefsTo(func_ea, 0):
print(f" Called from: {hex(ref)}")
call_count += 1
print(f" Total calls patched: {call_count}")
else:
print(f"[!] Failed to patch {func_name}")
print("===== Patch Complete =====")
if idaapi.is_debugger_on():
self.patch_peb_debug_flag()
def patch_peb_debug_flag(self):
try:
if idaapi.get_inf_structure().is_64bit():
gs = idaapi.get_reg_val("gs")
peb_addr = idaapi.get_qword(gs + 0x60)
else:
fs = idaapi.get_reg_val("fs")
peb_addr = idaapi.get_dword(fs + 0x30)
if peb_addr and peb_addr != idaapi.BADADDR:
being_debugged = peb_addr + 2
idaapi.patch_byte(being_debugged, 0)
print(f"[+] Patched PEB->BeingDebugged at {hex(being_debugged)}")
except:
print("[!] Failed to patch PEB->BeingDebugged")
def term(self):
pass
def PLUGIN_ENTRY():
return UltimateAntiDebugPlugin()
|
使用方法
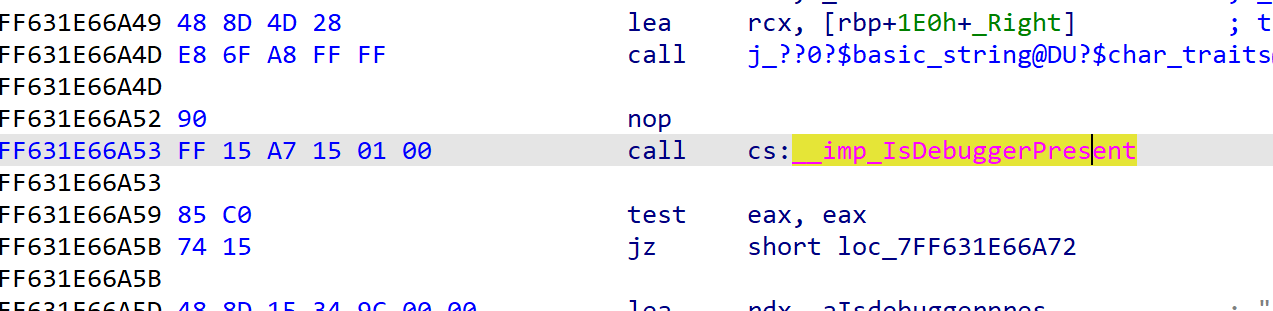
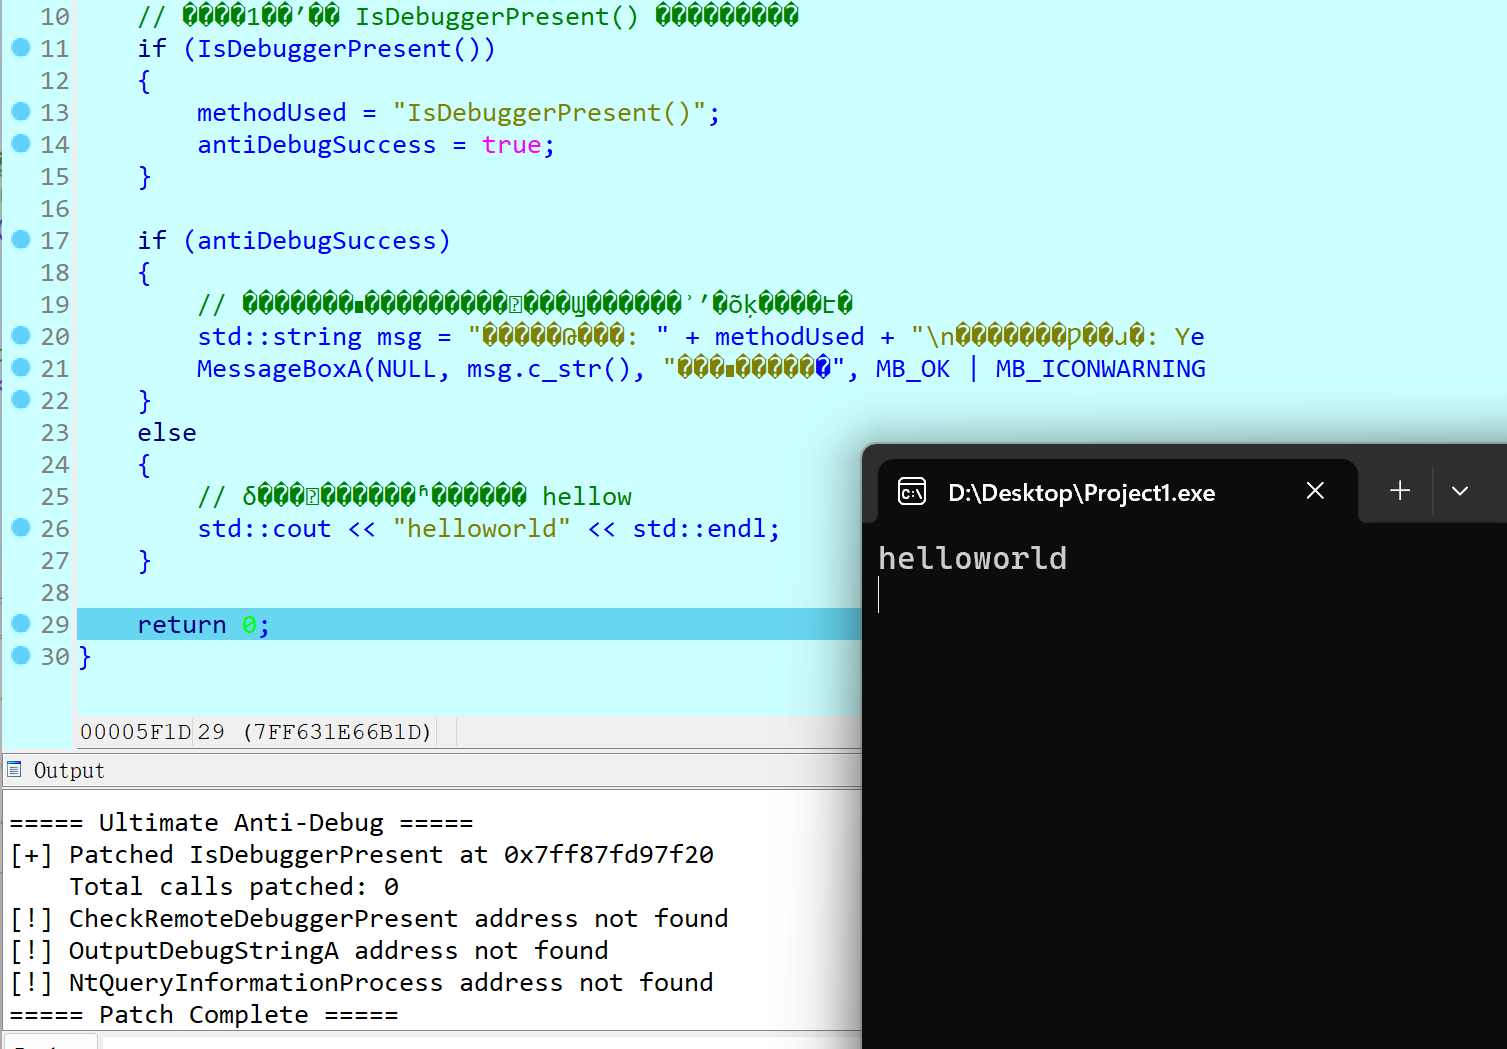
如示例程序使用了IsDebuggerPresent的反调试方法 IDA中可以看到有显式调用
将反反调试脚本放入IDA根目录的plugin目录下
重启IDA即可在菜单栏看到插件
使用IDA加载程序并进入调试模式 ,暂停程序到执行IsDebuggerPresent ,执行插件
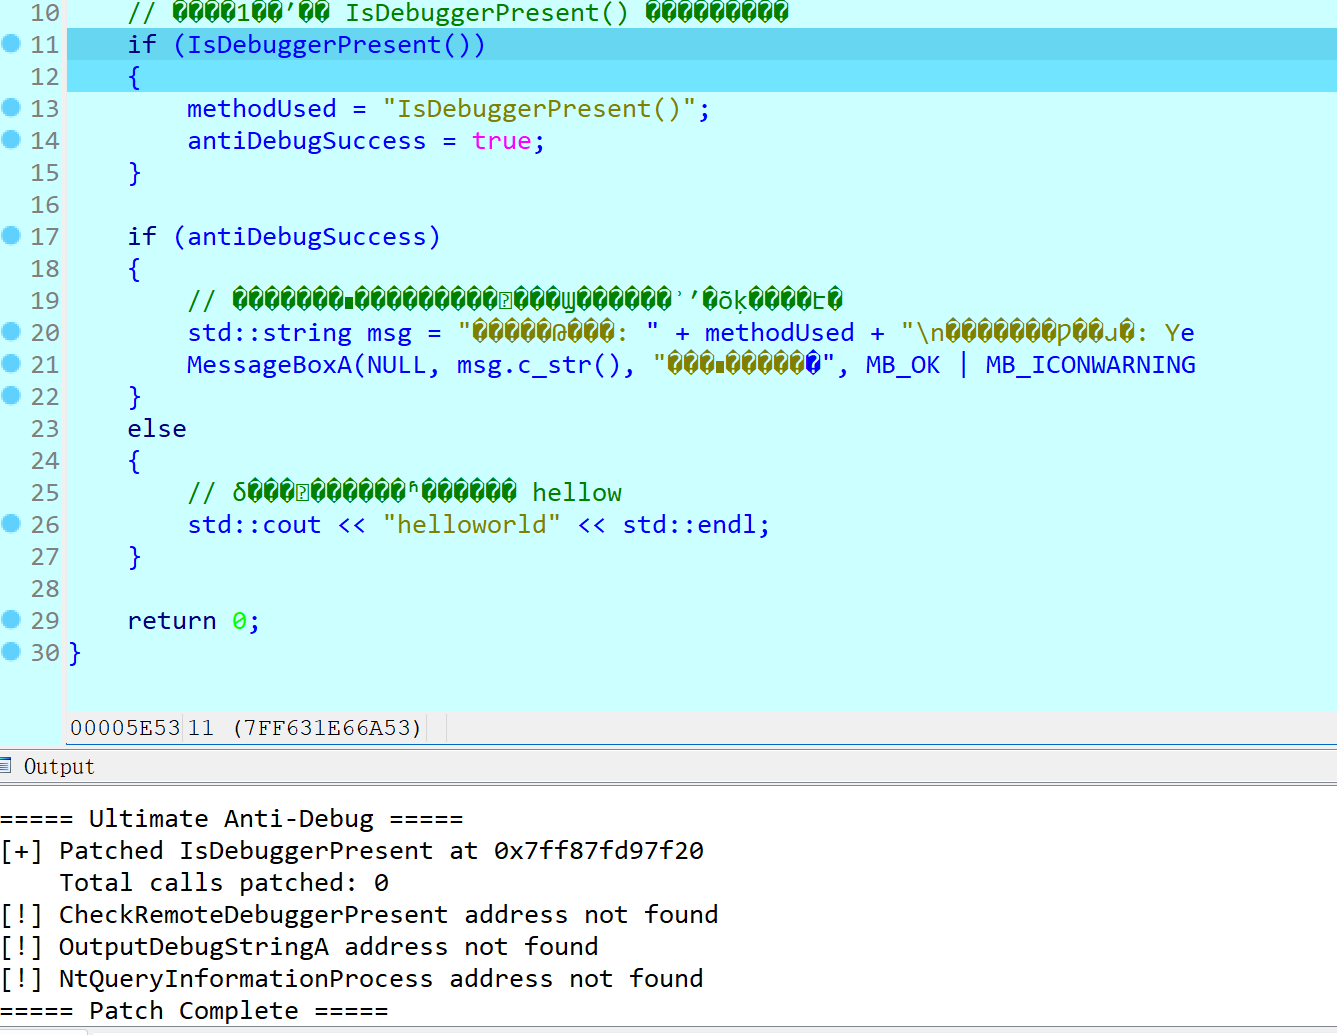
可以通过Output看到已经成功patch , 继续执行程序 已经绕过反调试机制

 wechat
 alipay